Proportional Representation
Depending on how democratic elections are structured, the resulting legislative body may or may not accurately reflect the entire will of the citizenry. For instance, in a First Past the Post system, like we have in Canada, those who voted for candidates that did not win may feel that their voice is not reflected in government, and that their vote was wasted.
Alternatively, electoral systems that have elements of proportionality built into them can address a number of perceived flaws found in more traditional voting schemes, and generally aim to have the elected body more accurately reflect the attitudes of all the voters. This site will convey some of the very basic concepts of proportional representation, without advocating any system in particular.
As Things Are Today
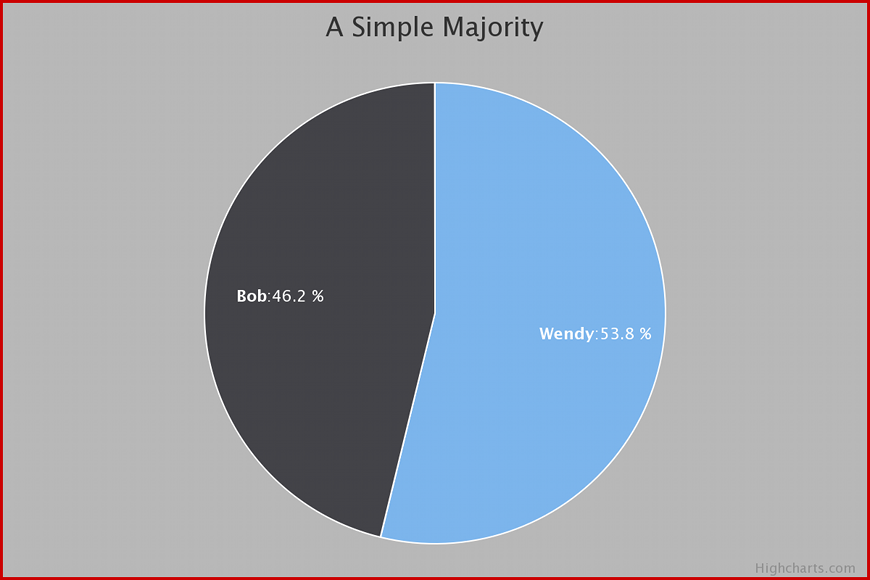
In Canada, provincial and federal elections are conducted using First Past the Post (FPTP) - essentially meaning the candidate with the most votes in a riding or district gets the win. Intuitively, it is easy to see why this should be so - particularly when there are just two candidates, as one candidate will get more than 50 percent of the votes cast:
Multi-Candidate Races
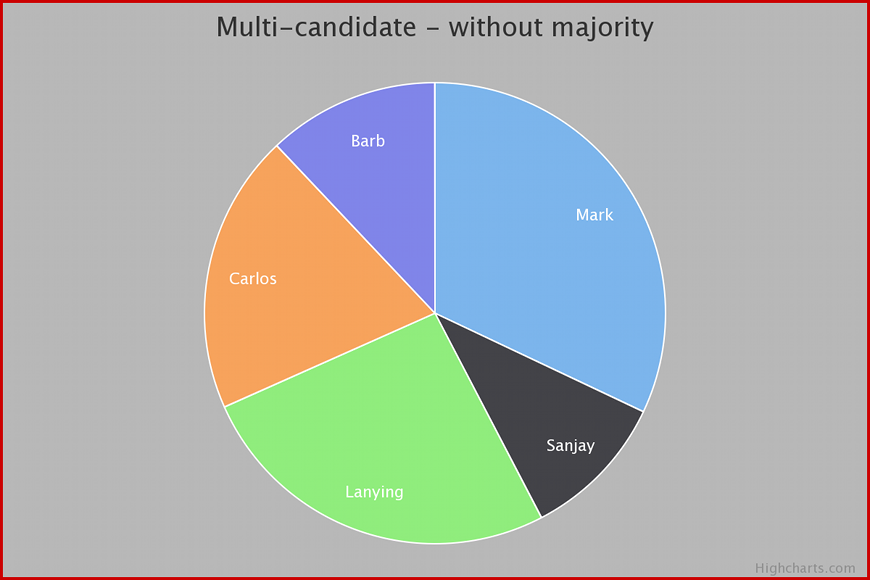
When there are more than two candidates, however, a more likely scenario is that all candidates will get less than 50% of the vote: in this case, candidate Mark receives the most votes (32%), and under FPTP, would win the seat:
Is Improvement Possible?
When a riding or district is won with less than half the total votes, it could be argued that the views and opinions of the majority in the riding are not directly being represented in the government. Even when a riding is won with a clear majority, there still may be a significant portion of the population that does not get adequate representation.
The goal of Proportional Representation (PR) is for a distribution in the elected body that is more reflective of the broad variety of viewpoints found in the voting public.
Strategies
Let's see how two different PR mechanisms can achieve the desired end:
- Supplemental Seats: additional representatives are elected based on vote proportions
- Multi-member Districts: the original number of representatives are elected, but come from new districts comprised of several former ridings
Example
For the sake of discussion, let's consider a city area with 5 adjacent voting districts, with the following distribution of votes in the last election:
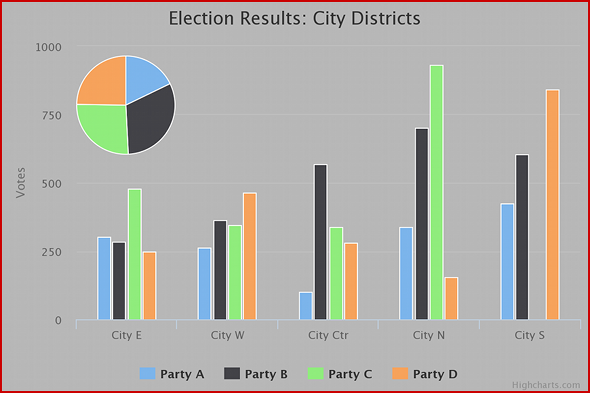
Election Results under FPTP
With FPTP, of the 5 elected officials, two would be from Party C (City E & City N), two would be from Party D (City W & City S) and the fifth would be from Party B (City Ctr).
The pie in the corner shows the combined votes across all 5 districts.
Note that the overall percentage of votes was highest for Party B, with just one elected representative; and that there is no elected representation at all for Party A.
Strategy 1: Supplemental Seats
Area Representation
Our first strategy involves electing additional members to the governing body based on the overall percentage of votes per party in a particular area. For this simple example, let's assume there are three additional members to be added for the five-district city.
Determining Which Parties Gets the Supplemental Seats
Simply, multiply the total number of members (eight) by the total percentage of the vote received by any party and that will indicate how many total representatives from that party should be in the government.
For instance, Party D got 24.7% of the vote; multiply by eight and you get two (rounded from 1.98). Since that party already got two district wins, no additional members from Party D will be added. The following table shows how the extra positions would be allocated:
| Party | Vote % | # Deserved | # Elected | # to Add | Total |
|---|---|---|---|---|---|
| A | 17.8 | 1.42 → 1 | 0 | 1 | 1 |
| B | 31.4 | 2.51 → 3 | 1 | 2 | 3 |
| C | 26 | 2.08 → 2 | 2 | 0 | 2 |
| D | 24.7 | 1.98 → 2 | 2 | 0 | 2 |
Strategy 1 Conclusion
The three adjustment seats are to be filled by two individuals from Party B and one from Party A. The result is that Party B now has the most representatives - which mirrors their highest vote percentage result. Also, Party A has one representative, which again agrees with their receiving a sizeable portion of the vote. Party C and D both remain with two representatives.
Strategy 2: Multi-member Districts
Voting in a Larger Area
Our second example strategy involves combining the city's five districts, prior to the vote, with the aim of still having the original number of (5) representatives. In this scenario, it is possible to have one or more candidates from each party in the area election since multiple candidates are to be elected in the area.
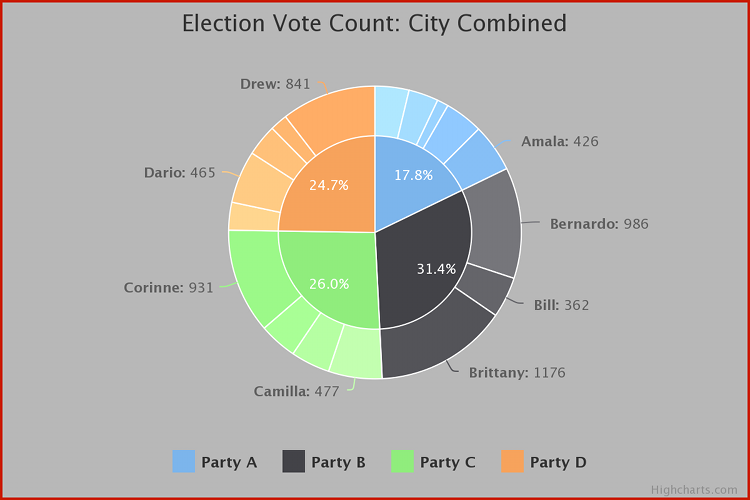
The following chart shows sample results for the election. The inner circle shows the overall vote percentage for each party, while the outer ring shows results for individual candidates from each party - labels show which candidates received over 350 votes
Determining Who Gets Elected
Following the vote, traditional FPTP is not used to determine representation. Rather, the number of representatives per party is again based on the overall percentage of the vote received per party. Let's assume though that the highest vote-getters for the party will earn the positions. The method is this: multiply the total number of members (five) by the total percentage of the vote received by any party and that will indicate how many total representatives from that party should be in the government.
For instance, Party B got 31.4% of the vote; multiply by five and you get two (rounded from 1.57). Then, determine the top vote-getters from that party, and those are the two representatives elected.
The following table shows how all of the positions would be allocated:
| Party | Vote % | # Deserved | Elected | Total |
|---|---|---|---|---|
| A | 17.8 | 0.89 → 1 | Amala | 1 |
| B | 31.4 | 1.57 → 2 | Brittany, Bernardo | 2 |
| C | 26 | 1.30 → 1 | Corinne | 1 |
| D | 24.7 | 1.24 → 1 | Drew | 1 |
Strategy 2 Conclusion
Although it's not always true that each party that participates gets representation, in our example all parties are represented by one member, the exception being Party B with two representatives - stemming from its combined higher overall percentage of the vote.
Also, note that the Party A representative, Amala, received fewer votes than other candidates (eg. Dario) who did not get elected.
Compare these results to those in the original 5 district city: Party C and D each with 2 representatives, Party A with 0 and Party B with 1. It is a fair argument that the resulting composition of the government is more representative of the voting public.